Eurostat import and export data for your EU market, turned into market intelligence.

Monthly EU import and export statistics for all 27 countries, every product code and every partner country, read for you: who is shipping what into your market, at what price, which origin is gaining on you, and what changed this month. No Eurostat bulk files, no spreadsheets.

Built on official Eurostat Comext trade statistics. Updated every month when Eurostat publishes. No scraping, no guesswork.
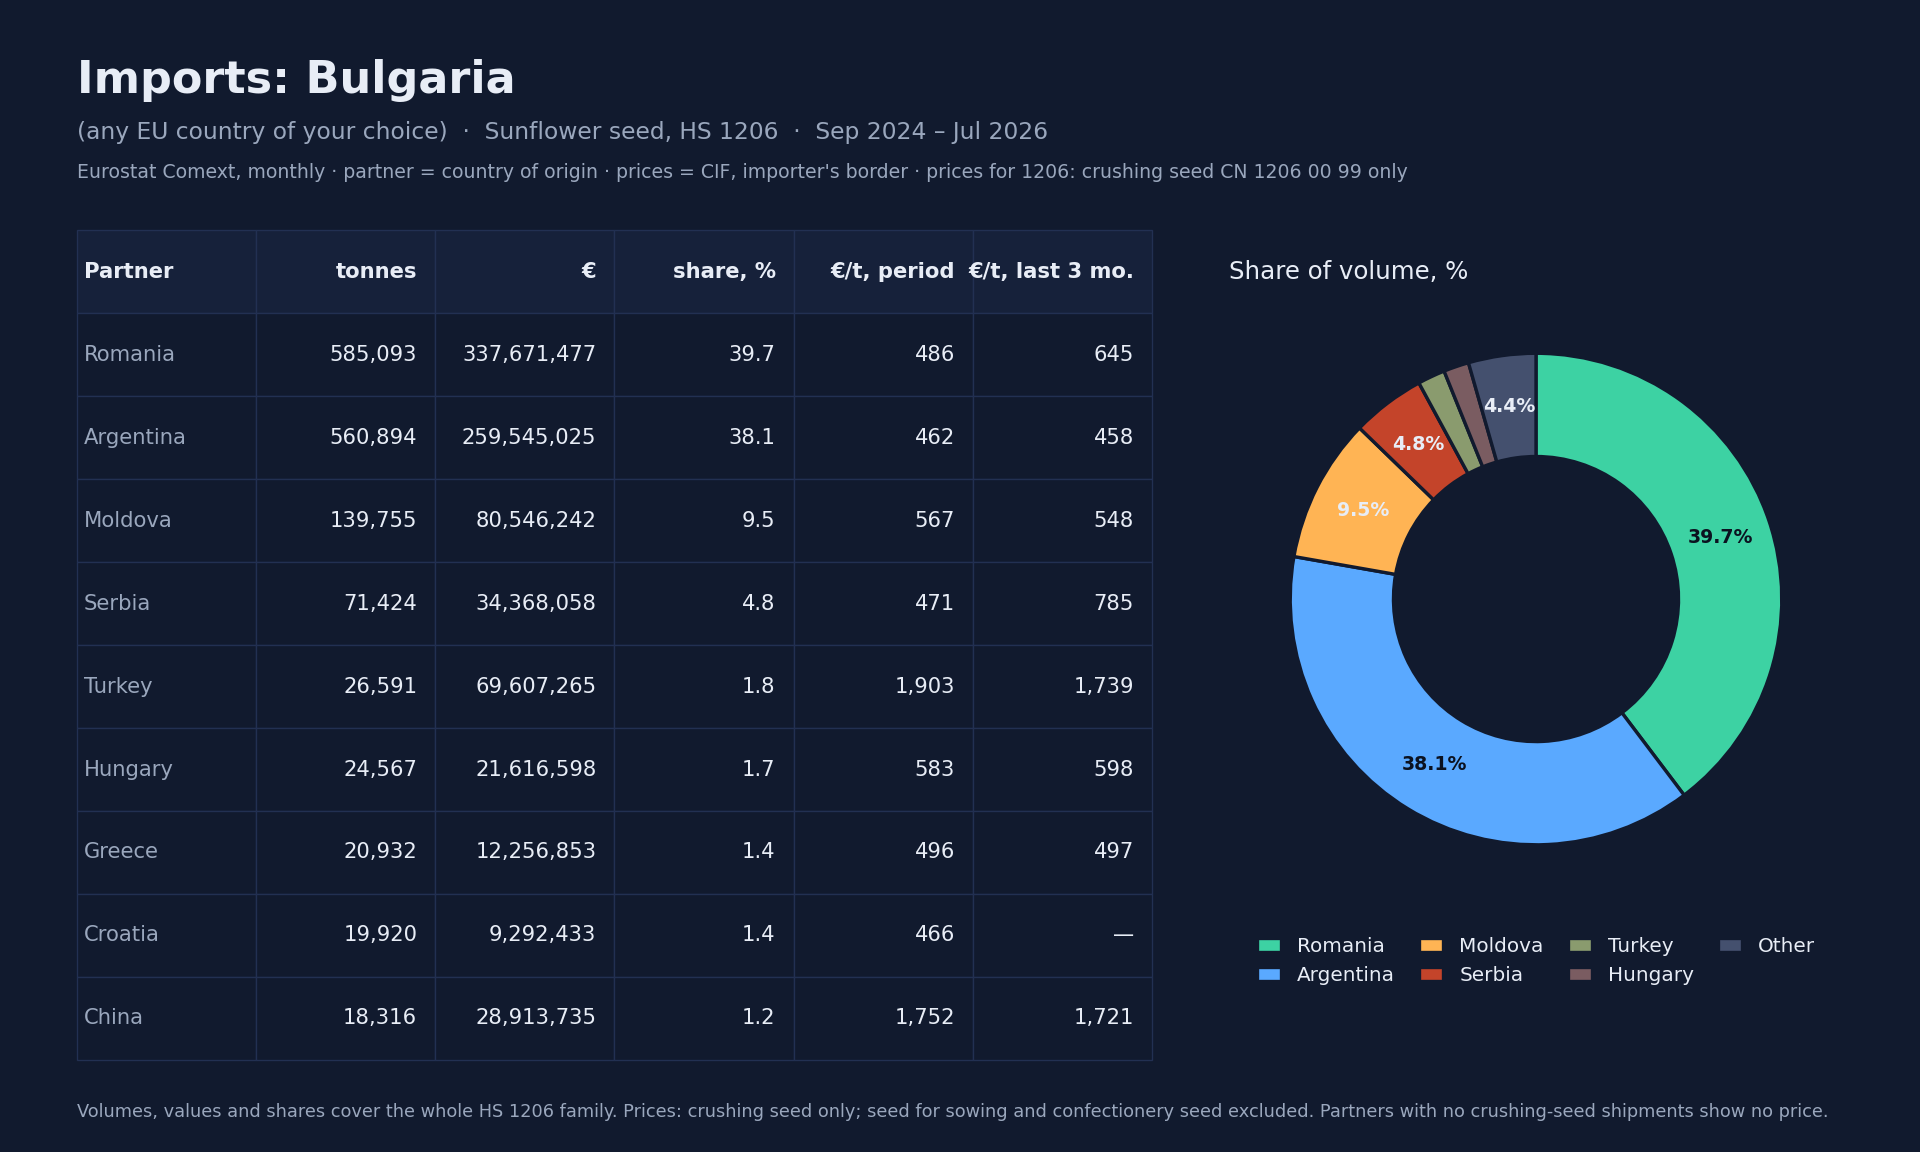
EU Trade Intel dashboard: partners table with volumes, shares and CIF prices, and a share chart
The dashboard, Partners view: who ships one product into one EU market, how much, at what share and at what CIF price. Here: sunflower seed into Bulgaria. Prices are taken from the commercial code (crushing seed, CN 1206 00 99) so seed-for-sowing lots do not distort them.
27EU reporting countries
200+partner countries and territories
9,000+product codes (HS2 → CN8)
24+ monthsof monthly history, tonnes and EUR/t

Eurostat trade data, without the spreadsheets

Everything in Eurostat Comext is public. Almost nobody uses it, because getting an answer out of it takes a data team. We did that part.

Bulk files, reconciled

Monthly extra-EU and intra-EU files loaded, aggregation levels reconciled, revisions tracked, confidential and partial records flagged so a gap in the statistics never reads as a gap in the market.

Prices, not just values

Average EUR per tonne by product, origin and destination, with FOB and CIF kept apart, so an exporter can compare a landed price in Italy with one in Poland in a single table.

Changes, not snapshots

Every number comes with its month-over-month and year-over-year move, the partner's share trend and a flag when a supplier appears or disappears. That is what a trading decision needs.

Made for companies that trade, produce or source inside the EU

The same data, read from three different seats.

Traders & distributors

Sourcing, pricing and arbitrage

Compare export FOB prices by origin with import CIF prices by destination, spot spreads between EU markets, and catch a new flow the month it appears in the statistics.

Producers & analysts

Competing imports into your home market

Track the imports that compete with your production, see which origin is taking share and at what price, measure concentration and seasonality, and brief management with numbers instead of anecdotes.

Exporters

Growing in another EU market

See which EU countries import your product, from whom, at what price, and where the incumbent supplier is losing share. Pick the market, then the moment. Works for exporters outside the EU too.

EU import statistics, export statistics and market intelligence, as a service

Choose a single service or combine them. Everything runs on the same monthly Eurostat dataset, so the numbers always agree.

Interactive EU trade-flow dashboard

Import and export statistics by country, product and partner: any EU reporter, any partner, any product family from chapter level down to 8-digit CN codes. Volumes, values, average prices, month-over-month and year-over-year, top partners, trade balance, seasonality.

Automated signals and alerts

New or vanished suppliers, partner share shifts, price anomalies versus the 6-month median, volume spikes and one-off shipments. Delivered by email when they happen, filtered by your products and markets.

Monthly commodity market intelligence digest

A five-minute briefing per product group: what moved, who gained, who lost, and the price trend. Available for grains and oilseeds, vegetable oils, fertilizers, polymers, basic chemicals, fruit and more on request.

EU Market Report

A PDF report for one product and one EU country: market size, growth, import origins, price corridor, concentration, seasonality, your position versus the top three competing origins, and a clear verdict on whether and when to move.

Buyer and supplier discovery

Shortlists of real importing and exporting companies, matched from official company registries and mirror customs declarations. Available today for Bulgaria, Greece and Romania; other countries on request.

Arbitrage and gap scanner

Where the same product is bought cheaper and sold dearer across EU borders, and which markets are concentrated on one or two origins and therefore open to a new supplier.

Custom analysis

One-off questions answered with data: "which EU countries grew imports of my product by more than 20% in the last 12 months and from which origins?" Delivered as a short report within days.

Data export and API

Clean CSV and Parquet extracts for your own models, or an API feed for your BI tools. No more downloading and cleaning Eurostat bulk files yourself.

Languages

Reports and support in English and Russian. Other languages on request for the Scorecard.
Signals from the latest month, as our subscribers saw them

Real examples from the current Eurostat dataset for sunflower seed, wheat and fertilizers. Each one is a reason to pick up the phone.

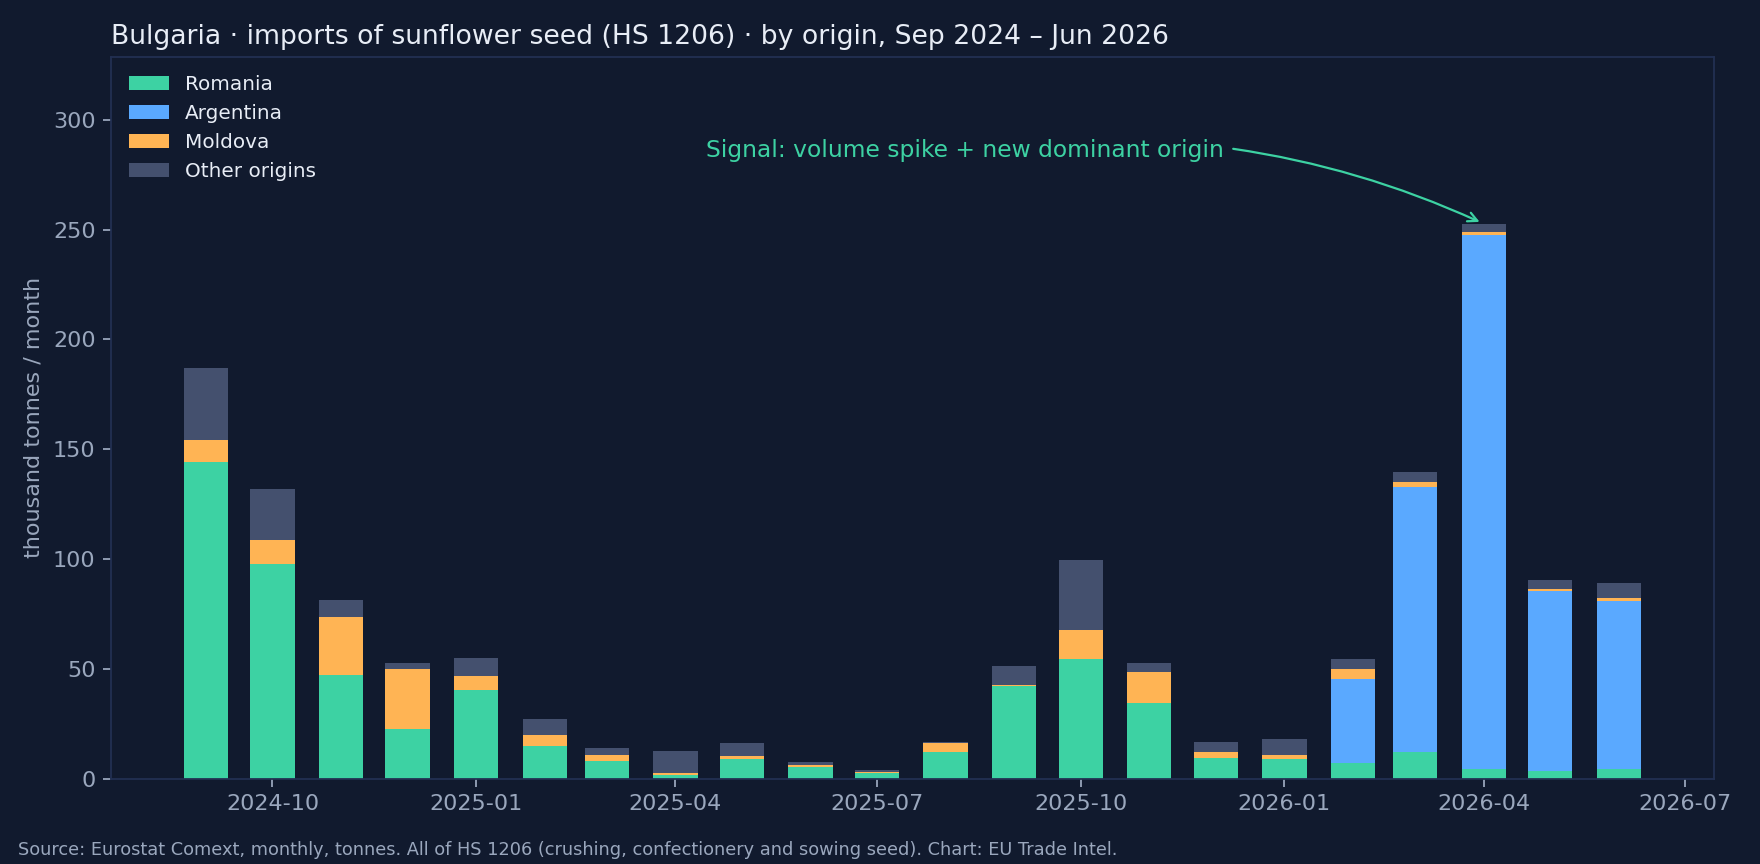
Bulgaria imports of sunflower seed by origin, monthly
How a signal is born: Bulgarian sunflower-seed imports by origin, 22 months. The spring 2026 spike and the new dominant origin triggered two alerts.
Bulgaria, imports of sunflower seed (HS 1206): 90,635 t in the month, up 454% year on year; crushing seed (CN 1206 00 99) at €477/t CIF. A new origin now holds over 90% of the quarter's volume.Signal type: volume spike + share shift
Romania, exports of common wheat (CN 10019900): Eritrea appears as a destination for the first time in 12 months with 30,663 t at €201/t FOB.Signal type: new partner
Bulgaria, imports of phosphate fertilizers (HS 3103): the Netherlands moves from 0% to 98% of the three-month window, 3,004 t at €312/t.Signal type: supplier replacement
Greece, exports of durum wheat (CN 10011900): Tunisia, active in six of the previous six months at ~29,000 t/month, has shipped nothing for two months. Last cargo: 54,978 t at €249/t.Signal type: vanished partner

How it works

Tell us your products and markets

Product codes or plain names, the EU countries you care about, and whether you look at imports, exports or both.

We configure your view

Dashboard filters, alert rules and digest groups are set up for you within two working days. No software to install.

You get the signals, monthly and on the day

A digest each month when Eurostat publishes, alerts in between, and a human on email when you want a number explained.

Plans

Prices exclude VAT. Cancel monthly plans any time. Founding subscribers keep their price for 12 months.

Digest
€179 / month

For one person following a few products.

  • Monthly digest for up to 3 product groups
  • Up to 5 EU markets
  • Email alerts on new and vanished suppliers
  • Email support
Start with Digest
EU Market Report
€490 one-off

One product, one EU country, delivered as PDF within 5 working days.

  • Market size, growth and seasonality
  • Import origins, prices, concentration
  • Your position versus top-3 competing origins
  • Buyer shortlist where registries are available
  • Clear verdict with reasoning
Order a report
What the Digest looks like
What the Report looks like
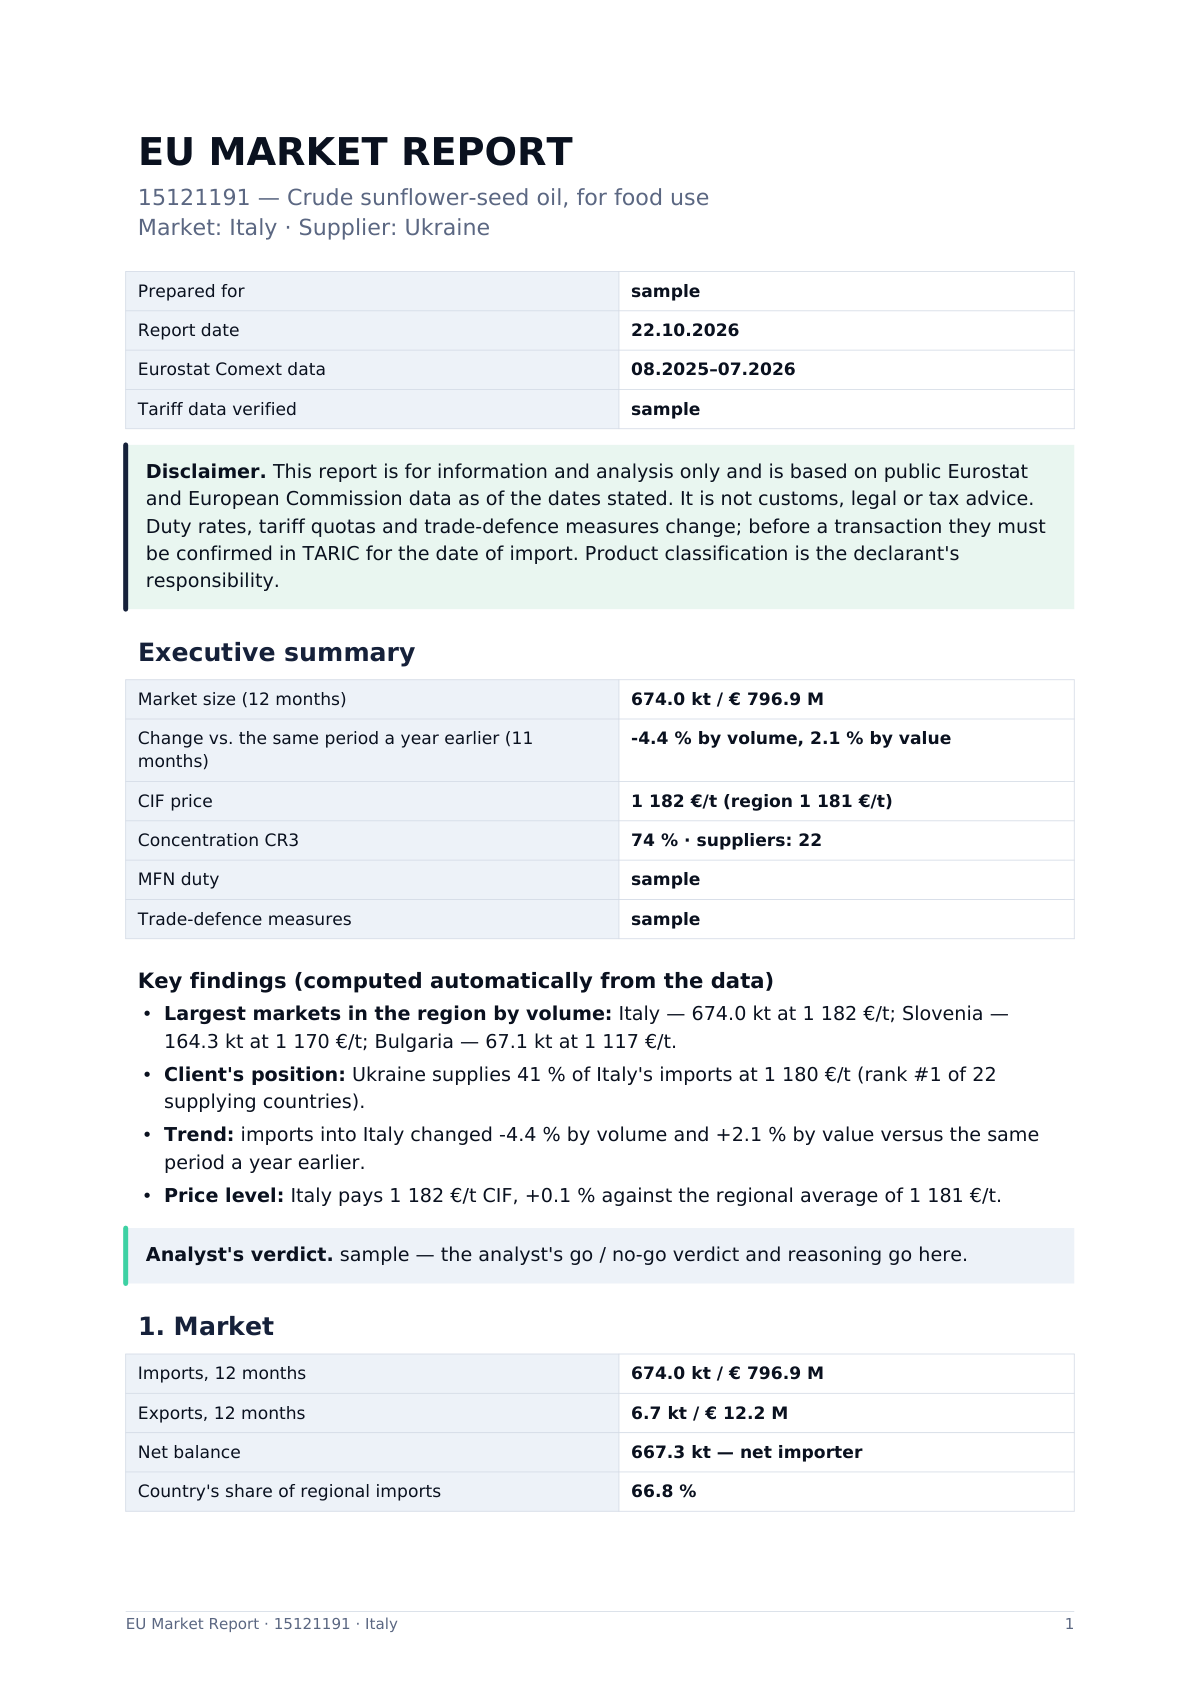
First page of a sample EU Market Report
First page of a sample report: sunflower oil (CN 1512) into Italy, generated from live data.

Need an API feed, more seats or a non-EU reporter? Ask for a custom plan.

Get a free sample report

Tell us one product and one EU market. We will send you a sample digest for it, and you can decide whether the full service is worth it.

No spam. One sample, then at most one email a month unless you subscribe. Privacy.

Questions

Is this the same as Eurostat's own Comext database?

Same source, different product. Eurostat publishes raw monthly files and a query tool built for statisticians. We load those files, reconcile and clean them, compute prices and changes, and deliver the result as dashboards, alerts and reports that a commercial team can use without an analyst.

Can I get import statistics by HS code and country?

Yes. Any HS2, HS4, HS6 or CN8 code, any of the 27 EU reporting countries, imports and exports, with every partner country, in tonnes, euros and euros per tonne, monthly for at least 24 months.

Where does the data come from?

Eurostat Comext, the official EU customs statistics database, at monthly frequency, including both intra-EU and extra-EU flows. We load the bulk files, reconcile the aggregation levels, and flag confidential or partial records so you are not misled by gaps.

How fresh is it?

Eurostat publishes extra-EU flows for month M around the middle of M+2, and intra-EU flows about a month later. Your digest goes out within 48 hours of publication.

Does it show company names?

Customs statistics are aggregated by country and product, not by company. Our buyer and supplier discovery service adds company-level shortlists from national registries and mirror customs data where those are available, currently Bulgaria, Greece and Romania, with more countries on request.

Can I just get the raw data?

Yes. Professional includes CSV export, and we offer Parquet extracts and an API feed on custom plans.

Which products are covered?

All of them. Deep ready-made baskets exist for grains and oilseeds, vegetable oils, fertilizers, polymers, basic chemicals and fruit; any other product family is configured on request at no extra cost.

Is there a trial?

Every plan starts with a free sample report for your product and market. If you subscribe and cancel within 14 days, you are refunded in full.